Announcement

Collapse
No announcement yet.

Squeezing 7 billion people into 841 square miles

Collapse
This topic is closed.
X
X
 
  • Filter
  • Time
  • Show
Clear All
new posts

    #16
    Re: Squeezing 7 billion people into 841 square miles

    Originally posted by GreyGeek
    The water you drank today was flushed down someone's toilet yesterday and tomorrow some doctor down stream from you will use what you flushed to wash his hands prior to his next operation.
    And it's this apparent lack of realization that cracks me up whenever homeopaths trot out their unscientific mantras of "water memory." Put aside for the moment at a 30C dilution far exceeds Avogadro's number. If water truly retained the memory of every substance it comes in contact with, then every drop you drink means that you're consuming the memory of billions of years of turds!

    Comment


      #17
      Re: Squeezing 7 billion people into 841 square miles

      Originally posted by SteveRiley
      ..... homeopaths ....
      I am resisting the temptation to go there... I am .... really, I am ....
      "A nation that is afraid to let its people judge the truth and falsehood in an open market is a nation that is afraid of its people.”
      – John F. Kennedy, February 26, 1962.

      Comment


        #18
        Re: Squeezing 7 billion people into 841 square miles

        Originally posted by GreyGeek
        Originally posted by SteveRiley
        ..... homeopaths ....
        I am resisting the temptation to go there... I am .... really, I am ....
        Do not tease me like that, O great Geek of Greyness. Let yourself go!

        (And do it quick, for my flight to Seattle is about to board, heh.)

        Comment


          #19
          Re: Squeezing 7 billion people into 841 square miles

          Hi
          It's not often that I demur from one of GG's posts but this is something that should be finally put to rest:

          exploding population

          This from wikipedia:

          Current projections show a continued increase in population

          (but a steady decline in the population growth rate),

          with the global population expected to reach between 7.5 and 10.5 billion by 2050.[7
          The original "Population Bomb" book speculated that we would all be living on artificial islands, and the second one and the third one...none of them were correct.

          Yes, the world population is increasing....but the

          amount of increase

          is less each year...

          the present projection is DOWN a billion or so from just a few years ago...

          http://en.wikipedia.org/wiki/World_population

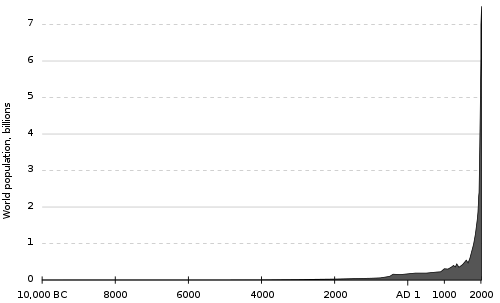
          I would SINCERELY like for everybody to STUDY this image...it is THE STOCK IMAGE....showing that the world is going to hell in a handbasket from population growth.


          ok for those of you who are not good with graphs...

          always pay attention to the "zero" and the number on the right end of the X axis...

          notice that the right end is for the year...

          2000!!!!!!!

          OMG THE WORLD IS COMING TO AN END....

          ummmmm the graph projection stops at 2000!

          it is now...2011!!!

          Now take a look at this graph:


          Every few years Paul Ehrlich puts out a new rant, although in his last book he was not ranting he was bleating, about how the world population is going to destroy the world....

          and a few years after he publishes his book the population is LOWER than his estimate by oh.... twenty percent...

          I have ALL of his books....

          I put them on the lab table with yellow sticky notes on the pertinent pages...and the appropriate lines of text highlighted

          and have the students walk up to inspect them.

          and then they go to a computer and find the actual numbers from the WHO and the U.N.

          and then.....

          the students start to think.

          I'm sorry GG but in terms of the global population...on this one I'll have to take the position of the loyal opposition...

          BUT LOCALLY.....you are quite correct....

          LOCALLY.........there are MASSIVE problems as in Africa with warlords killing people right and left

          and the Palestenians and Isralies arguing NOT over religion or "land" or any of that crapp@#$....but the WATER beneath the highlands...

          woodsmoke

          Comment


            #20
            Re: Squeezing 7 billion people into 841 square miles

            Your comments about the affects of local warlords on the population of Africa imply what doesn't actually happen ... i.e., population declines. (unless they start using nukes!)

            If you look at the period of times between 1915-1920 and 1935-1945 you'll notice that your curve does not show a decline or even slowing down of the population growth during those two periods, despite the fact that more than 79 MILLION people were slaughtered during WWII, 15 MILLION during WWI, to say nothing of the 29 MILLION killed in the Russian civil war and by Stalin.

            In fact, lets expand our date range to the entire 20th century, 1900-1999. R.J Rummel, in his book "Death By Government" documents the deaths of more than 1/3rd of a BILLION people during a time when the population grew 4.25 BILLION. The graph shows no dip during the 20th century, just an inexorable rise.

            But, let's review the basics of exponential growth. Exponential growth rates are often shown by a plot of the solution of the equation:
            dN/dt = rN (1)
            where r is the rate of natural increase, N is the current population and dN/dt is the current change rate of N.

            Integrating that between 0 and t yields
            N(t) = N(0)e^rt (2)
            where N(0) = population at time t=0, N(t) = population at time t, and r is the rate.
            When a population doubles
            N(t) = N(0)*2
            Plugging that in to (2) yields
            t = 0.69/r
            which is valid for any exponential growth curve, i.e., population curve. If a population has a growth rate of, say, 2.5% per year its population will double in t = 0.69/0.025 = 30 years. However, growth rates are notoriously variable. The population will double in 30 years ONLY IF the growth rate remains at 2.5% during that 30 years. Therein lies the rub. Who knows if that rate will change or not?

            Since 1970, for example, as Woodsmoke notes, the world population growth rate has steadily declined. The UN report in which his graph is included also has a graph of the decline of the growth rates till 2050:
            [img width=400 height=364]http://ubuntuone.com/67CsQtLZ4Q1D3szPovJjrm[/img]

            The UN Report states that IF the world population continued to express the current growth rates the population would be 136 TRILLION in 2300 That isn't going to happen. The report does give a low of 2.3 billion, a medium of 9 billion, and a high of 36 billion! Interestingly, that report states that after 2100 birth rates will no longer be an influence on population!! It claims that life spans will rise to between 95 and 107 years. But, surprisingly, it claims that by 2100 the fertility rates will be negative for developed countries and less than 0.5 for undeveloped countries, but the population will be stable because of increases in life expectancy. Table A11 shows that Muslim countries will exhibit a 10 fold increase in population while China and India remain at their present levels. The USA will be at 493 million. By 2300 it claims that the "Total Fertility" (number of kids per woman) will be between 2.029 and 2.069.

            Getting back to the math... when r=0 then dN/dt = 0 (ZPG) and the population ceases to grow. This can happen when a population runs out of food or resources. The limiting value of the population that can be supported in a particular environment is called its carrying capacity and is designated K, and it gives rise to the classic "S" curve shape. When the population is far below K, the maximum population it can carry, often called the "growth potential", growth is exponential, but as the population approaches K, it begins to encounter ever-stronger "environmental resistance".

            The expression (K − N)/ K is often used as a "growth realization factor", that is, a factor representing the degree to which the population can actually realize its maximum possible rate of increase. We can factor this term into equation #1:

            dN/dt = rN(K-N)/K (3)

            which gives

            N(t) = (K e^( K+rt))/(e^(K+rt)-1)

            The equation tells us that if the size of the population (N) is far below the carrying capacity of the environment (K), the growth realization factor will be close to 1, and the population will show exponential growth. But, as N begins to approach K, the growth realization factor approaches zero, and the rate of population growth drops to zero, or ZPG.

            What the UN is saying is that the human population uses a "K strategy", which includes most species which produce only a few offspring per year, as opposed to fish and insects which are "r" strategists. Thus, human population on the world stage hasn't shown a Boom & Bust periodicity, but it does appear to be sliding into the top half of the "S" curve, which always happens when a population approaches the K value. The two most critical resources for human population growth are 1) water and 2) fuel. That's why I mentioned that in the USA it seems obvious that we've reached the carrying capacity that 1,430 cu miles of fresh water can support. Failure to appreciate that fact will lead to conflict and confrontation between the set of haves and have-nots, which will be translated into the rich against the poor. It may be that 193 million MORE people will be able to live in the USA and share the same 1,430 cu miles of water. Time will tell. The USA is using almost 8 BILLION barrels of oil per year. Anyone who is familiar with oil production understands that the size of "GIANT" oil fields have drastically and dramatically decreased over the last 40 years. The ANWAR, off shore and tar sands in North Dakota and Canada cannot even begin to replace the oil in the volumes that we import from the Saudi fields.

            BUT, the UN report doesn't use exponential GROWTH rates! Their model is based on Fertility Rates and beginning on page 99 they develop their mathematical model to predict population. They are the same models that the UN has been using for decades. In 1960 von Foerster, Mora, and Amiot published, in the journal Science, a striking discovery. They showed that between 1 and 1958 CE the world's population dynamics can be described in an extremely accurate way with an astonishingly simple equation:
            N(t) = C/(t0 - t)^0.99
            where N(t) is the world population at time t, and C and t0 are constants, with t0 corresponding to an absolute limit ("singularity" point) at which N would become infinite. Parameter t0 was estimated by von Foerster and his colleagues as 2026.87. Their projection was based on the rational function defined by:
            p(year)= 1.79*10^11 / (2026.87-year)^ 0.99
            which corresponds to November 13, 2026; this made it possible for them to supply their article with a public-relations masterpiece title – "Doomsday: Friday, 13 November, A.D. 2026"
            It predicts the population for 2011 as 10.5 billion. For 30 years following its release it was within statistical error of the official population statistics, and considerably more accurate than fertility models made at the time. This model was the first to uncover the hyperbolic nature of the world's population prior to 1970. Since then the population growth seems to have diverted away from hyperbolic growth.

            A variation of the equation is:
            p(year) = 189648.7/(2022 - year)

            Note that if von Foerster, Mora, and Amiot also had at their disposal, in addition to world population data, data on the world GDP dynamics for 1–1973 (published, however, only in 2001 by Maddison [Maddison 2001]), they could have made another striking "prediction" – that on Saturday, 23 July, A.D. 2005 an "economic doomsday" would take place; that is, on that day the world GDP would become infinite if the economic growth trend observed in 1–1973 CE continued. They also would have found that in 1–1973 CE the world GDP growth followed a quadratic-hyperbolic rather than simple hyperbolic pattern. It seems that the real fireworks began in 2008.

            For the mathematically inclined, the Doomsday Equation was derived from
            dN/dt = (N^2)/C

            Hyperbolic models match well with GDP, literacy, and the size of settlements. The year everyone is literate is 2033, and the more people there are the larger our "settlements" will become. How long before we have cities with 50 million within their limits?


            The argument against a population disaster is that a larger population will have more scientists, which will invent more technologies, which will allow better utilization of natural resources which will increase K. Rinse and repeat. The problem is that technology growth is driven by energy resources. We are in a race against disaster to create the next inexhaustible energy source before our Carbon fuels are exhausted. The race may be a photo finish. Some say the population bomb has already exploded, and we have already lost the energy race because we started 25 years too late. We'll run out of oil before we can get the replacement in place. To avoid total disaster the population will have to be dramatically decreased. Unfortunately, the Arabs and Israeli's are working on a solution to that problem as fast as they can. If things go from bad to worse, hyperbolic math also shows that the maximum number of people the Earth can support by foraging alone is approximately 10 million, assuming there is enough flora and fauna left to support any foraging at all.


            "A nation that is afraid to let its people judge the truth and falsehood in an open market is a nation that is afraid of its people.”
            – John F. Kennedy, February 26, 1962.

            Comment

            Working...
            X